Insights
See how your agent is performing — activity, audience, intent, engagement, funnel, and operations.
Insights turns your conversations into analytics. A date-range picker, a channel filter, Apply, and Export CSV sit at the top of every view, and the data is organized into six tabs.
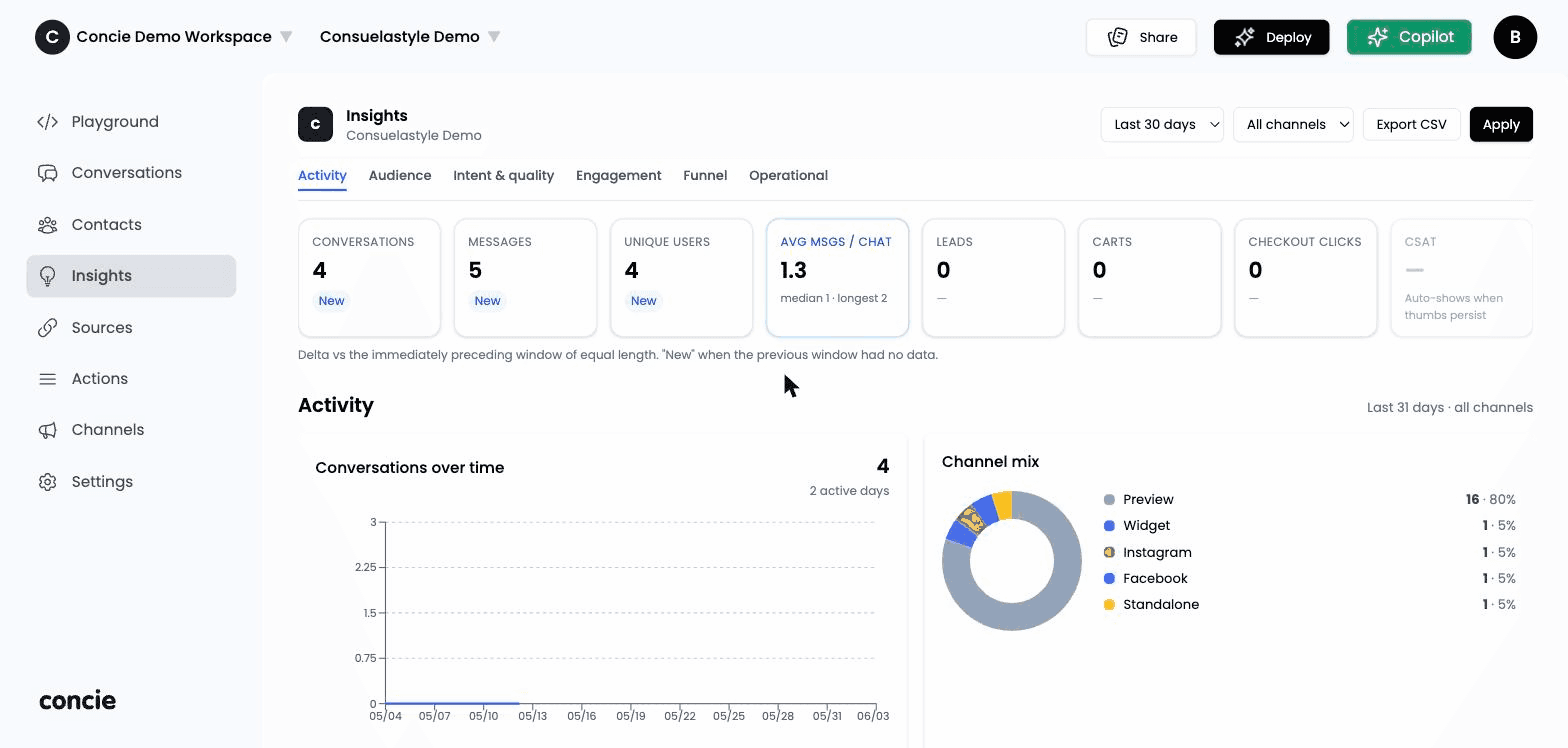
The six tabs
| Tab | What it shows |
|---|---|
| Activity | Volume and commerce KPIs + trends (the default view). |
| Audience | Who's talking to your agent — by channel, country, and language. |
| Intent & quality | What customers ask about, sentiment, and answer quality. |
| Engagement | How deeply customers engage with the agent. |
| Funnel | Where customers progress and drop off. |
| Operational | Operational health — handoffs and response behavior. |
Activity
The headline KPIs, each with the change vs. the previous equal-length period (or New when there's no prior data):
- Conversations, Messages, Unique users, Avg msgs / chat (with median and longest)
- Leads, Carts, Checkout clicks — commerce signals
- CSAT — appears once thumbs-up/down feedback accumulates
Below, Conversations over time charts volume, and Channel mix breaks down where conversations came from (e.g. Preview, Widget, Instagram, Facebook, Standalone) with shares.
"Checkout clicks" counts customers who clicked through to checkout — a strong intent signal, not completed purchases.
Filters & export
- Date range — pick any window; Concie auto-compares it to the previous equal-length period.
- Channels — narrow to one platform, then Apply.
- Export CSV — download the underlying data.